Now that the most recent set of MOT data is out, we’re diving in to see what it tells us. We’ll cover which cars are doing best, how pass rates vary over the year – and what’s going on with the nation’s driving habits as a whole.
Contents.
- Average mileage is still at lockdown levels.
- Don’t be mean: why averages can be deceptive.
- What does this mean for insurance.
- Mileage by fuel types.
- Pass rates.
- The best time to book your MOT.
- The best (and worst) makes and models.
- The best colour (maybe).
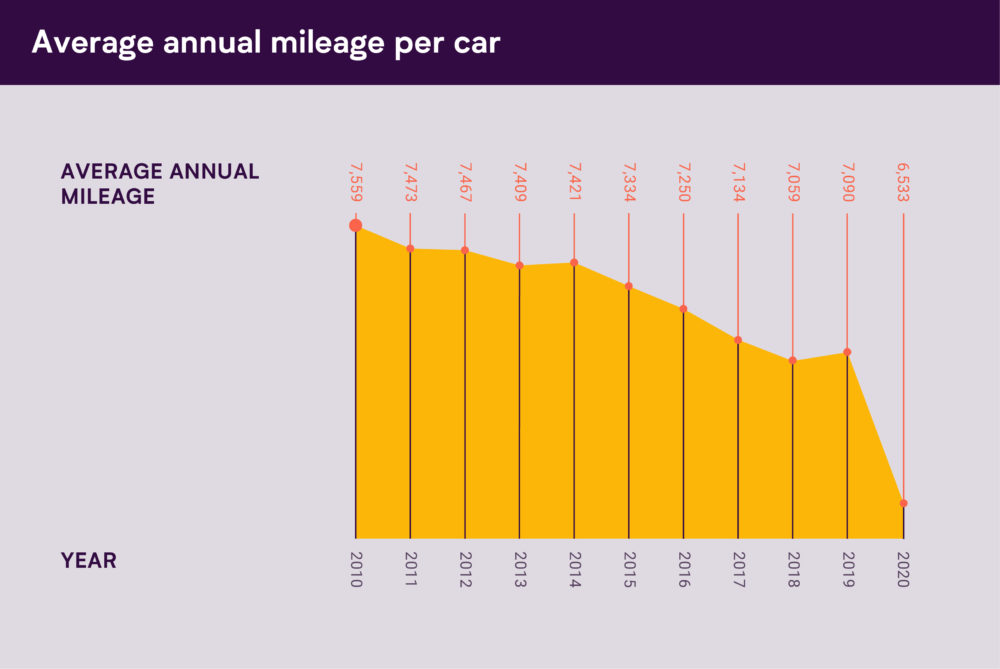
Average mileage is still at lockdown levels.
When we look at the longer term trend, the UK’s mileage has been on a downward curve for a long time. Unsurprisingly, the pandemic pushed that to a bit of an extreme. What is perhaps surprising, is that the UK’s mileage is still lingering at those levels years later.
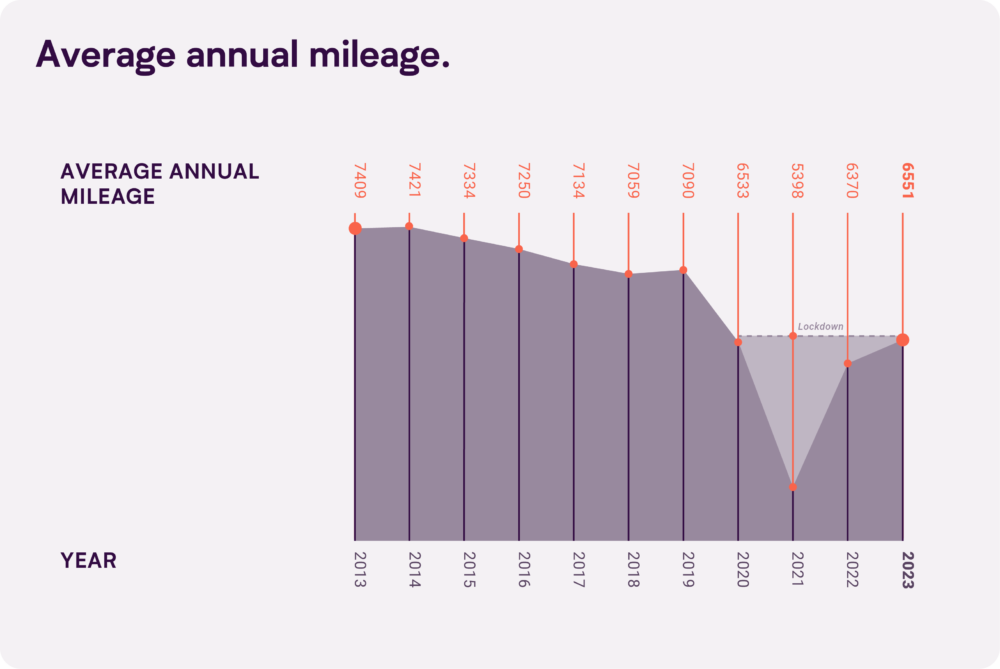
Recently released data for 2023 shows the nation’s national average went up a smidgen. But context is important here. Mileage is still coming up from a big, big dip in 2021.
The average mileage we’re at now – 6,551 miles a year – is virtually identical to 2020, a year that saw multiple national lockdowns.
It’s been a longtime since any of those restrictions have been in place. So it’s fair to say that it looks like people’s day-to-day lives simply involve less driving than they used to.

To put it simply, if you ignore the weirdness of the Covid era, you can see that the overall downward trend has continued.
In fact, average mileage (mean) is down 12% over the last decade.
Looking back 10 years, average annual mileage has fallen by a whopping 1,097 since 1012.
Don’t be mean: Why averages can be deceptive.
Those numbers above use a kind of average called ‘the mean’. This number can be skewed if a few people are doing extremely high mileage. So it’s good to look at another kind of average: the mode. This gives a clearer idea of the mileage most people actually people do.
If we break the UK up into brackets of 1,000 miles, the most common bracket is actually just 3,000 – 4,000 miles.
So even though the mean mileage is 6,551, if you had to guess the mileage of a random member of the public, statistically your best bet would be somewhere around 3,500.
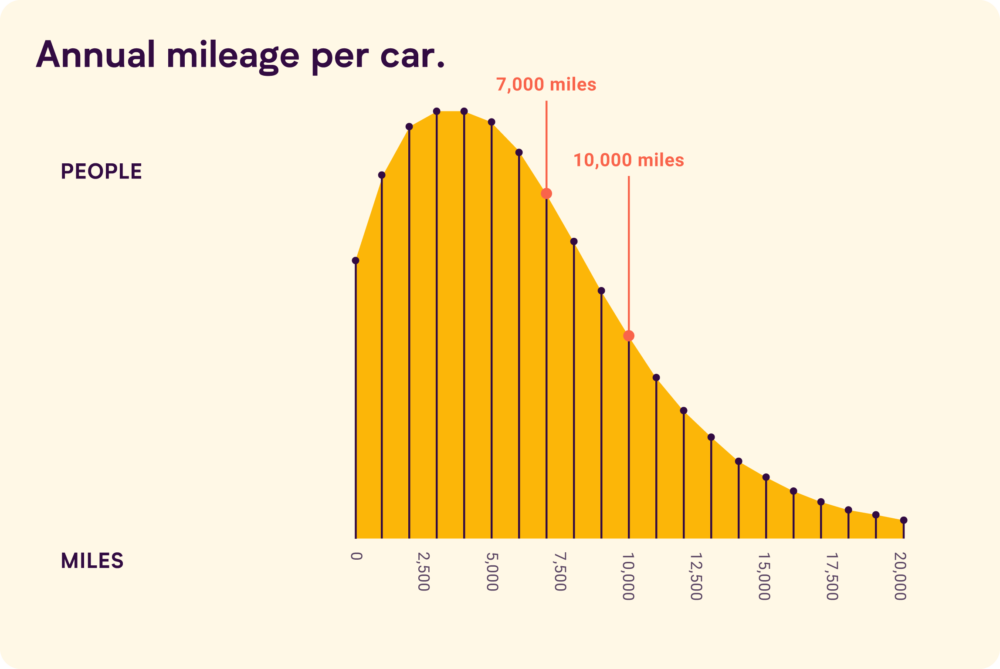
In fact, someone driving the ‘mean’ mileage of 6,551 miles a year would actually only be in 6th most common bracket. Basically, a lot more people do below “average” mileage than you would think.
What does this mean for car insurance?
Pretty much everything has gotten more expensive over the last few years. Unfortunately, many things relating to the cost of car insurance – like parts and repairs, and replacement vehicles – have gone up well above inflation.
At the same time, crime has been high, meaning more claims. This has had a big impact on the cost of cover. With car insurance getting more expensive in general, it’s more important than ever to pick an option that really fits.
If you’re a lower mileage driver (and as we’ve seen from the data above, there’s a good chance you are) pay-by-mile car insurance could help you save. So why not get a quote and see.
Now what else does the data tell us?
Those with petrol cars drive less than average.
As in previous years, average mileage varies a lot by fuel type – and the average for petrol cars is actually below the national average as a whole. Why might that be?
Well in previous research we’ve seen that higher income households tend to drive more – roughly 4 times more to be exact – than other Brits. As electric and hybrid cars are often on the pricier end of the scale, it’s likely they’re more often used by those higher mileage drivers.
| Fuel type | Average annual mileage |
| Gas Bi Fuel | 9936 |
| Hybrid (Clean) | 9805 |
| Electric Diesel | 9637 |
| Gasl | 9547 |
| Gas Diesel | 8460 |
| LPG | 8119 |
| Diesel | 7900 |
| Electric | 7285 |
| Fuel Cells | 7155 |
| Other | 6867 |
| Petrol | 5348 |
| CNG | 4966 |
| LNG | 3726 |
Pass rates are down quite a bit.
The overall MOT pass rate fell from 78.1% to 76%. It’s possible that with mileage climbing back up slightly after the major lows of the last couple of years that cars are seeing a bit more wear and tear.
Pass rates for the newest cars (3-5) years stayed more or less the same at 89%.
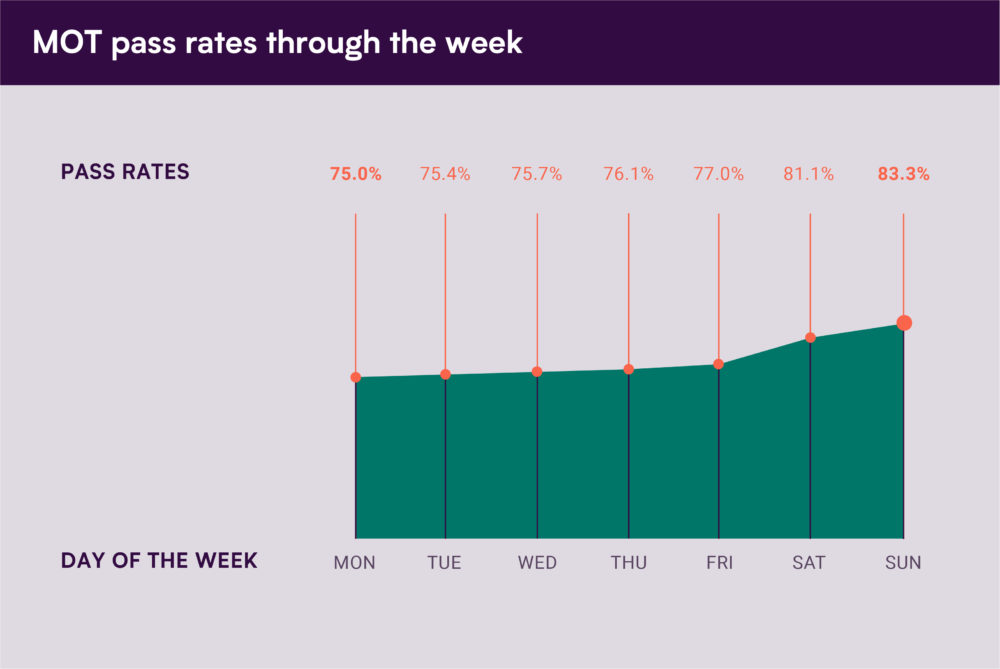
Pass rates increase over the week.
In past MOT data, we’ve always found that pass rates go up across the week, and that’s proven true again this time – rising by 9.4% percent from Mondays to Sunday.
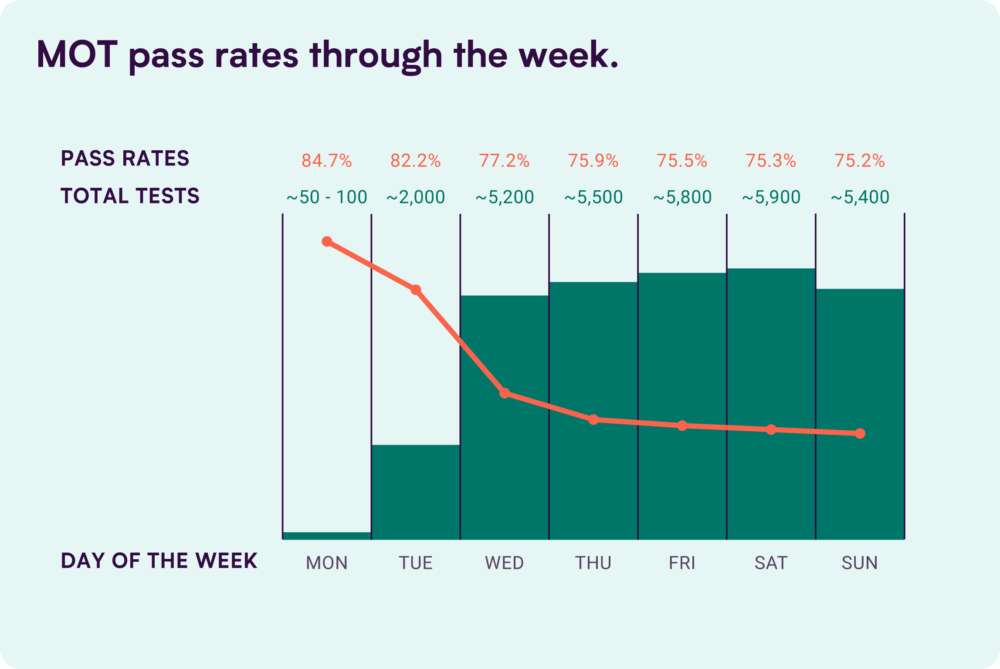
Fewer centres are open on weekends, so less testing gets done then – and that will skew the figures. But the rate still goes up over the working week. For example, the pass rate on a Friday is 2% higher than Monday despite very similar levels of testing.
So if your test is coming up, think about booking it for as late in the week as you can.
No idea when you need to book your MOT by? Use our handy little checker.
(Psst. Not sure when you need to book your MOT by or how to prepare? Don’t panic – just use our checker and read our MOT guide.)
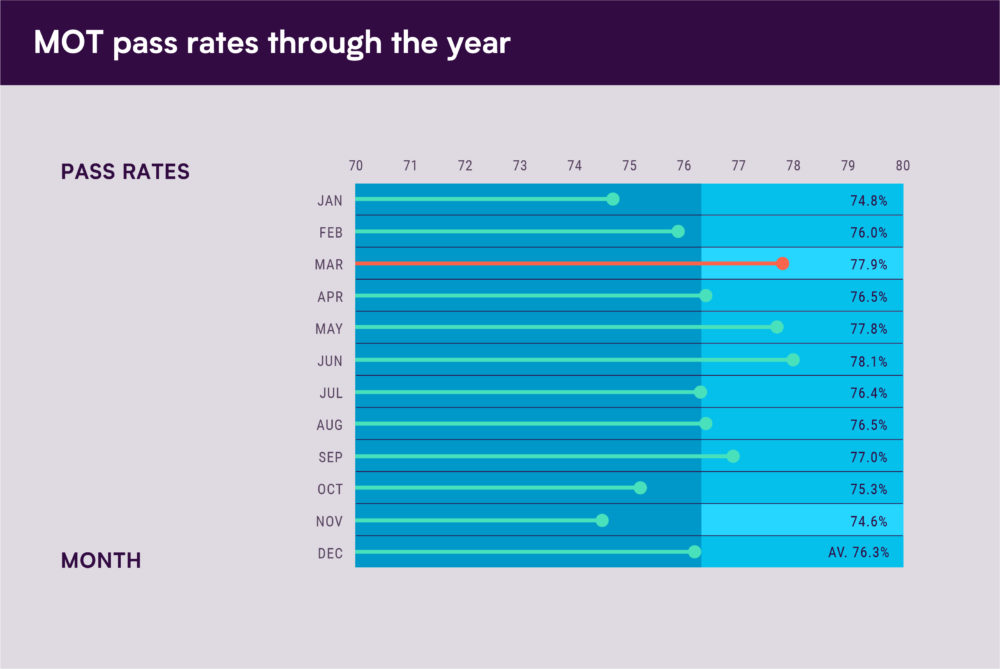
Winter is the least magical time of the year (for an MOT)…
You may love the season of warm cocoa and cosy nights in, but the chances are your car isn’t such a fan. The two months that see the pass rate dipping below 75% are October and November – with December and January not much better.
The three months that saw a pass rate of 77% or higher were March, July and September.
Obviously, there’s a degree of randomness here, as most people will leave their MOT until close to its due date. But it’s pretty clear that your chances of passing get a bit of a boost between the start of Spring and end of Summer.
But there’s an exception…
The 24th December 2023, saw an MOT pass rate of 92.7% – the highest of the year. So is harnessing the magic of Christmas a must-know MOT hack? Probably not. Understandably, very few cars were tested on this day, so it’s a bit of a useless statistic. (Unless it comes at the pub quiz, in which case you’re going to be majorly chuffed to have read this).
Cars in the 3-5 year range.
All the analysis below is based on cars aged 3-5 years – so it could be a good measure of how the cars are made as opposed to how they’re used or treated.
The 4 of the top 5 manufacturers are Japanese.
Which manufacturer’s cars do best at MOT time? Well, when it comes to the 3-5 year age range, the top 5 is very similar to last year’s. Toyota have dropped out and been replaced by Mazda – so Japanese companies still make up the majority of the list. The only European entry is Porsche, and you’d expect those to be pretty well-built given the price tag.
| 2022 | 2023 | ||
| Make | Pass rate (%) | Make | Pass rate (%) |
| Lexus | 95.3 | Lexus | 95.2 |
| Porsche | 94.4 | Porsche | 94.8 |
| Honda | 94 | Honda | 94.2 |
| Toyota | 92.1 | Suzuki | 92.8 |
| Suzuki | 92.1 | Mazda | 92.5 |
…and it’s a clean sweep in the top 5 models.
In the last set of data, the Skoda Karoq gave European manufacturers a little bit of representation in the top 5 models for cars of 3-5 years old. But this time around Japan has it all sewn up, with Honda and Toyota nabbing 2 spots each.
| 2022 | 2023 | ||
| Model | Pass rate (%) | Model | Pass rate (%) |
| Honda Jazz | 95.4 | Honda Jazz | 95.4 |
| Honda HR-V | 94.6 | Honda CR-V | 95.1 |
| Honda CR-V | 94.4 | Mazda CX-3 | 93.9 |
| Mazda CX-3 | 93.8 | Toyota Rav-4 | 93.8 |
| Skoda Karoq | 93.7 | Toyota Yaris | 93.3 |
The bottom 5 isn’t all European this time.
In the last two sets of data, the bottom manufacturers for cars of 3-5 years in age were all European. Not this time, though.
That said, if you were looking for a little bit of local pride, don’t whip out the bunting just yet. Britain still has two makes on the list.
Interestingly, all of the bottom 5 have seen a dip in pass rate compared to the previous results.
| 2022 | 2023 | ||
| Make | Pass rate (%) | Model | Pass rate (%) |
| MG | 88 | MG | 87.2 |
| Vauxhall | 87.6 | Vauxhall | 86.8 |
| DS | 87 | Citroen | 86.4% |
| Renault | 86.6 | Renault | 86% |
| Citroen | 86.4 | Tesla | 85.3 |
Britain and France provide the bottom 5 models.
The Mercedes Vito has escaped the bottom 5 and the Vauxhall combo has come in. As a result, all of the bottom 5 models in the 3-5 year age range come from either side of the Channel, with 3 French and 2 British entries.
If you’d like something to cheer, the Renault Trafic did improve a tiny bit (0.2%).
| 2022 | 2023 | ||
| Model | Pass rate (%) | Model | Pass rate (%) |
| Peugeot Partner | 80.9 | Peugeot Partner | 79.9 |
| Mercedes Vito | 80.6 | Citroen Berlingo | 79.2 |
| Citroen Berlingo | 80 | Renault Trafic | 78.6 |
| Vauxhall Vivaro | 79.8 | Vauxhall Vivaro | 78.4 |
| Renault Trafic | 78.4 | Vauxhall Combo | 78.4 |
And finally…turquoise retains top spot.
Traditionally, we’ve found that when we analyse MOT data for cars in the 3-5 year bracket by car colour (because, why not?) it’s usually gold and turquoise battling it out for the crown. With a 93.3% pass rate, turquoise has managed to take the win for a second year on the trot – whilst gold could only manage 4th place, behind maroon in 2nd and yellow in 3rd.
Why do these colours have higher pass rates? Simply because there’s far, far fewer of them, so the stats aren’t really as accurate. Of the colours that are a bit more common, red came out best at 91%.
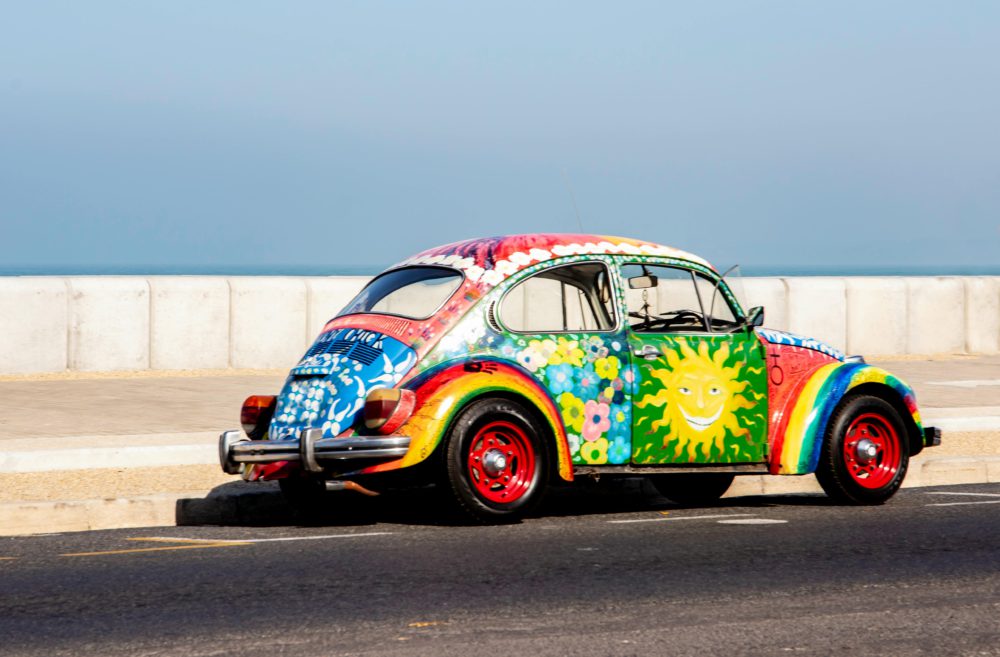
Multi-coloured cars came out worse despite being rare – possibly because clowns tend to be accident prone.
Sources.
You can find Government data from the nation’s MOT tests going back to 2005, here.
You can find our previous deep dives below.
The 2022 data.
The 2021 data.
The 2020 data.
The 2019 data.