Now that the nation’s MOT data for 2022 is out, we’ve been taking a look at the numbers. Read on and find out which makes and models are statistically most reliable, when it’s best to take your test – and what’s going on with our overall driving habits.
Contents.
- Low mileage is
the newnormal. - Does lower mileage make driving cheaper.
- Pass rates.
- Mileage by fuel types.
- The best time to book your MOT.
- The most (and least) successful colours.
- The best (and worst) makes and models.
Lower mileage is the new normal.
It’d be easy to say that it was the pandemic that turned the UK into a nation of lower mileage drivers. But if we zoom out a little, we can see that’s not really true.
From 2010 to 2018, our average annual mileage fell by 500 miles – down to 7059. So, even before Covid came along people had generally been driving less and less for a decade already.
Of course, lockdowns of 2021 and 2022 had a big impact on the nation’s driving habits (as you can see from the dip in the graph below). But in 2022, none of those restrictions applied. You might have thought that would lead to a big jump in mileage, with folks going back to their pre-pandemic driving habits. But that’s not how it’s gone.
The downward curve continues.
Average mileage for 2022 is up from the incredible low of 2021. But as you can see, it’s still in keeping with the overall trend of falling mileage.
In 2022, the UK’s average mileage was 6,370. That’s 720 miles less than in 2019 – the last year where there were no lockdowns to skew the comparison. (In fact, it’s still less than in 2020, when there were lockdowns!)
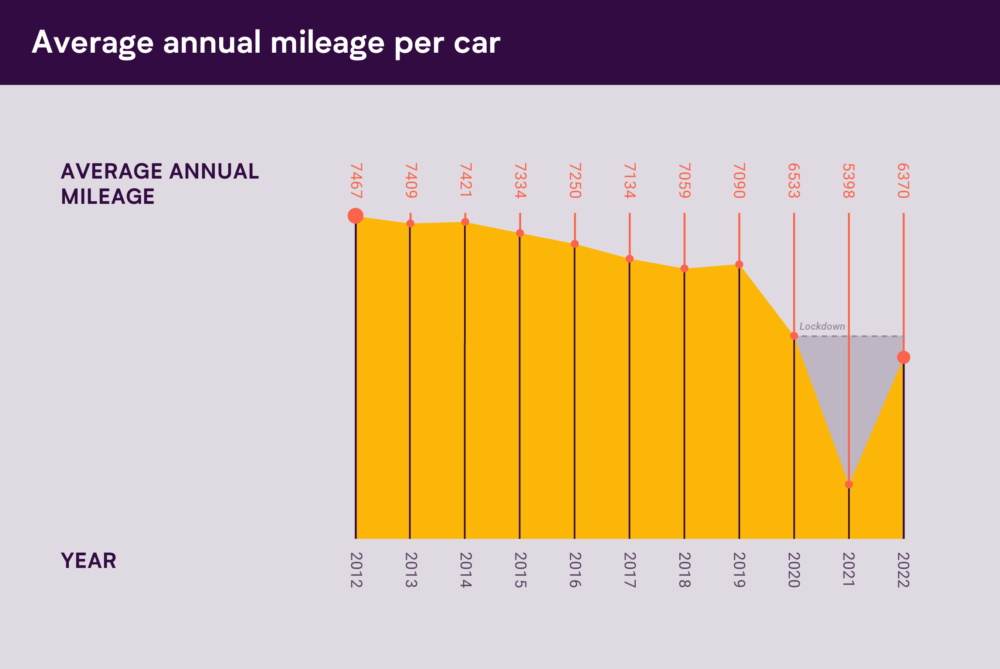
Looking back 10 years, we see that average annual mileage has fallen by a whopping 1,097 since 1012.
Of course, there’s more than one way to figure out an average. The ‘mean’ mileage is 6,370 per a year. But that number is impacted by the small number of people who drive huge amounts each year.
Looking at the modal average is a good way to ignore outliers – and shows how normal lower mileage lifestyles have become.
The most common mileage bracket for Britain’s drivers is now just 3,000 – 4,000 miles a year.
All that just goes to show not just how much our driving habits have changed – but that the change seems to be here to stay. Why is that?
Well, there’s been a huge rise in working from home. A lot of companies (us included!) switched to hybrid working, loved the benefits and never went back.
On top of that, people have gotten used to buying all kinds of things online that they might have driven out to buy before.
Finally, there’s the ongoing cost of living crisis. With everyone looking to make their money go further, a lot of people have cut out back on driving to save money. (On that topic, check out the cost of living episode of Driving Change below).
Does a lower mileage make driving cheaper?
It makes straightforward sense that the less you drive, the less it should cost you. It’s true for petrol. It’ll be true for maintenance (unless you’re really unlucky). So what about car insurance?
Well you may be unpleasantly surprised to learn that many car insurers have traditionally charged lower mileage drivers more. And could be especially painful given that the industry has been hurt by worse-than-inflation price increases.
We didn’t think that was fair, which is why we launched our pioneering pay-by-mile policies. In the last 5 years, we’ve covered over 500 million miles of driving, helping lower mileage drivers all over the country save on their cover.
But what is a lower mileage driver? When we started out, average mileage was around the 7,000 mile mark. Our pricing has always been geared toward helping as many people as possible who drive less than that to get a better deal. These days, that bracket includes 64% of the country. If that’s you, why not a quote?
Right then. What else have we learnt from the new MOT data?

Pass rates are up a fair bit.
The overall MOT pass rate was up from 2021, rising from 75.6% to 78.1%. With lockdowns now completely over, it’s possible that people were putting a little more thought into keeping their cars in decent shape.
…but not so much for newer cars.
Looking specifically at newer cars (aged 3-5 years) pass rates were up too – by a massive 0.1%. They rose from 89.3% to 89.4%.
A lot of the nation’s miles are done by electric and hybrid cars.
As you can see below, the mileage you’re likely to be doing varies a lot depending on the kind of car you have. The average annual mileage for petrol cars is just 5,121. Meanwhile, the numbers are higher for many cleaner fuel types. So why is that?
A while back we did a bit of research which showed that richer households drive around 4 times as much as those on lower incomes. These cars still tend to be more expensive than petrol models, they’re more likely to belong to those who are better off.
Diesel vehicles seem to do a lot miles, but does numbers are probably down to haulage.
| Fuel type | Average annual mileage |
| Electric Diesel | 9559 |
| Gas | 9471 |
| Gas Diesel | 8869 |
| Gas Bi-Fuel | 8687 |
| Hybrid Electric (Clean) | 8282 |
| Steam | 8031 |
| Diesel | 7777 |
| LPG | 7447 |
| Fuel Cells | 6960 |
| Other | 6939 |
| Electric | 6534 |
| Petrol | 5121 |
| CNG | 4943 |
| LNG | 4311 |
Pass rates increase over the week.
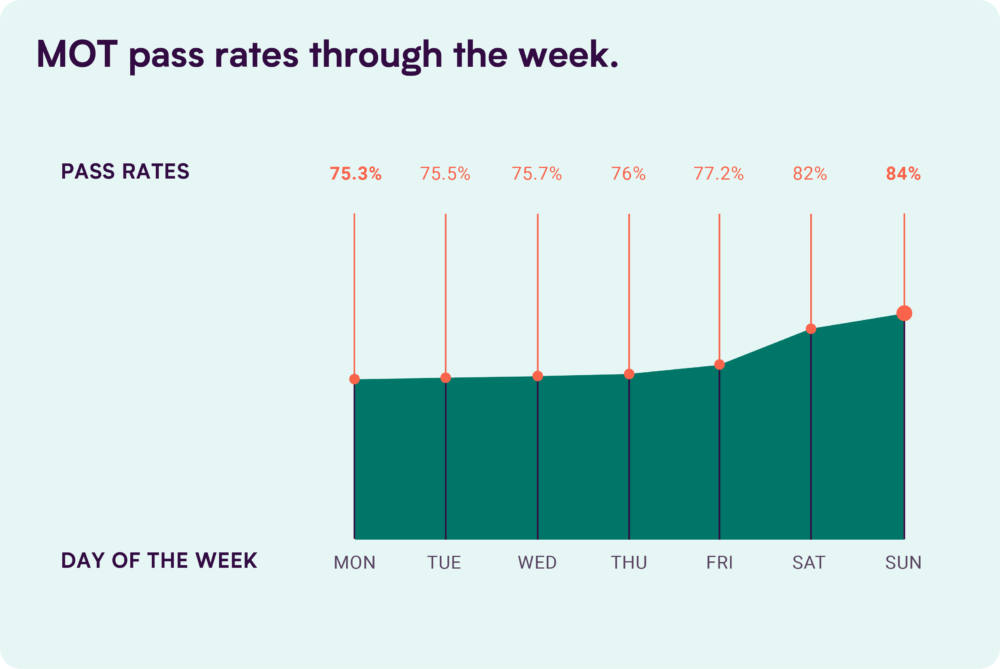
Last time we dived into the data, we found that pass rates go up over the week – and the same was true again in 2022.
The pass rate was 75% on Mondays, gradually creeping up before peaking at 84% on Sunday.
That 9% difference is significant. So Sunday isn’t just the best for wolfing down a nice roast – it’s also the best day to book you MOT.
(Psst. Not sure when you need to book your MOT by? Don’t panic – just use our checker.)
Summers sees a seasonal boost.
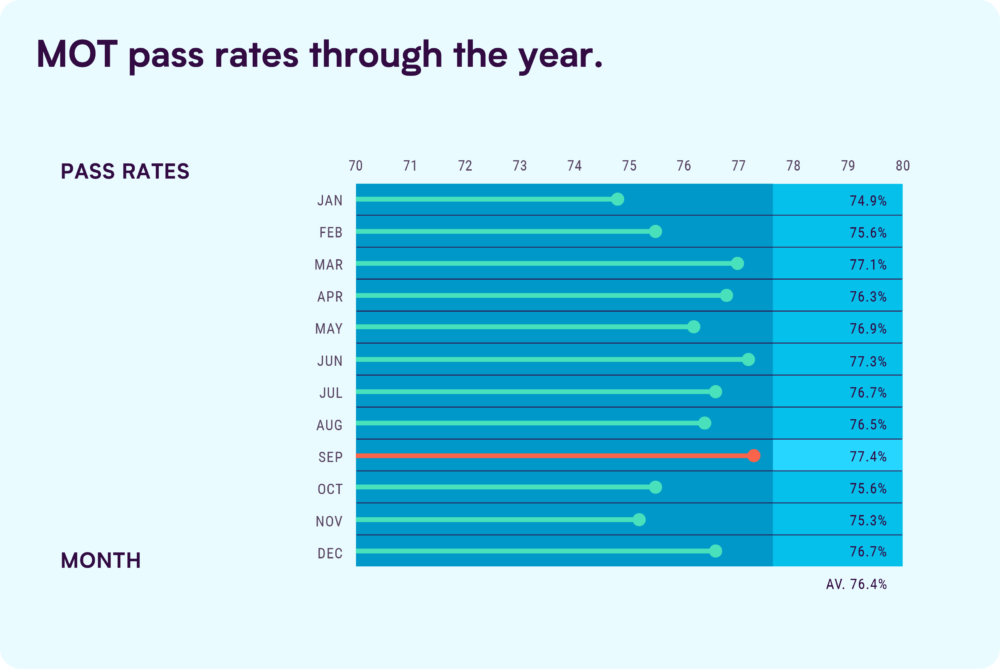
As a general rule, the warmer the weather, the better your chances of getting through your MOT. In the Winter, pass rates hover around 75% – whereas they’re up around 77% during the milder months.
June and September saw pass rates of 77.3 and 77.4% respectively. At the other end of the spectrum, in January and November only 74.9% and 75.3% of cars passed.
So while you’re booking things to do this summer, put your MOT in the diary before that mini break.
A Christmas miracle? Probably not.
On 25th December 2022, 96.3% of cars tested passed their MOT – the highest daily rate of the year.
Was that down to Santa spreading good cheer to the nation’s test centres? Perhaps his elves were helping out fixing the odd problem here and there before the examiners saw? Or it just might be because there were only 27 tests done nationwide rather than the usual thousands. Who can really say?
Make some noise for turquoise.
In previous years, it’s been a battle between turquoise and bronze for the colour with the best pass rate. Turquoise won in 2020, but in 2021 bronze took gold (confusingly) – squeezing into top spot by just 0.01%.
This time round, turquoise has reclaimed the crown with a pass rate of 92.4%. (Here’s hoping that comes up for you at the pub quiz.)

Multi-coloured cars did worst with an 86.7% pass rate. It probably doesn’t take too much imagination to figure out why that might be…
The top 5 manufacturers are mostly Japanese.
Looking at cars in the 3-5 year old range, we see 80% of the list are from the land of the rising sun. The only change from the previous year’s data is that Porsche – the only European brand in the list – has edged above Honda.
| 2021 | 2022 | ||
| Make | Pass rate (%) | Make | Pass rate (%) |
| Lexus | 94.7 | Lexus | 95.3 |
| Honda | 94.1 | Porsche | 94.4 |
| Porsche | 94 | Honda | 94 |
| Toyota | 92.3 | Toyota | 92.1 |
| Suzuki | 92.3 | Suzuki | 92.1 |
…and it’s the same for the top 5 models.
In 2021, Honda had the 3 most reliable models in the 3-5 year category. In 2022, that top 3 is completely unchanged. There’s another Japanese model in 4th, and the top 5 is rounded out by a newcomer – the Skoda Karoq.
| 2021 | 2021 | ||
| Model | Pass rate (%) | Model | Pass rate (%) |
| Honda Jazz | 95.5 | Honda Jazz | 95.4 |
| Honda HR-V | 94.8 | Honda HR-V | 94.6 |
| Honda CR-V | 94.5 | Honda CR-V | 94.4 |
| Audi Q2 | 93.9 | Mazda CX-3 | 93.8 |
| Suzuki Celerio | 93.6 | Skoda Karoq | 93.7 |
The bottom 5 makes are all European. Yet again.
Just as Japanese makes dominate the leader board, the wall of shame is very European – just as it was in 2021. Peugeot have escaped the bottom 5 at the expense of MG. However, the bottom 3 is still made up of less fortunate (and, it would seem, reliable) French makes.
| 2021 | 2022 | ||
| Make | Pass rate (%) | Model | Pass rate (%) |
| Peugeot | 88.2 | MG | 88 |
| Vauxhall | 87.5 | Vauxhall | 87.6 |
| Renault | 86.7 | DS | 87 |
| DS | 86 | Renault | 86.6 |
| Citroen | 86 | Citroen | 86.4 |
The worst models are getting worse.
The bottom five models list is almost identical to the last set of data – but overall their pass rates are going down. Apart from a slight uptick for the Vivaro, the bottom 5 are all did slightly worse than they managed a year before.
| 2021 | 2022 | ||
| Make | Pass rate (%) | Model | Pass rate (%) |
| Volkswagen Caddy | 82.3 | Peugeot Partner | 80.9 |
| Mercedes Vito | 81.5 | Mercedes Vito | 80.6 |
| Citroen Berlingo | 80.2 | Citroen Berlingo | 80 |
| Vauxhall Vivaro | 79.6 | Vauxhall Vivaro | 79.8 |
| Renault Trafic | 78.9 | Renault Trafic | 78.4 |


